One-Sentence Definition
The Rho Index measures the degree to which asset or portfolio returns are associated with changes in interest rates over a defined period.
What It Measures
- Interest-rate sensitivity: how returns tend to move as rates rise or fall.
- Directional exposure: whether rate changes historically correspond to positive or negative performance.
- Strength of relationship: the magnitude and stability of the rate–return association.
Where It’s Used
- Portfolio analysis: assessing rate exposure across asset classes.
- Macroeconomic research: studying market response to monetary policy shifts.
- Risk management: identifying sensitivity to tightening or easing cycles.
- Benchmarking: comparing interest-rate dependence across time or strategies.
Why an Index Matters
Interest rates affect many assets indirectly and with varying lag. A standardized index provides a shared reference for describing that sensitivity, improving clarity when comparing results across periods, portfolios, or studies.
The Rho Index is descriptive rather than predictive. It summarizes observed relationships and does not imply causation
or future performance.
Example: Rolling 12-Month Rho
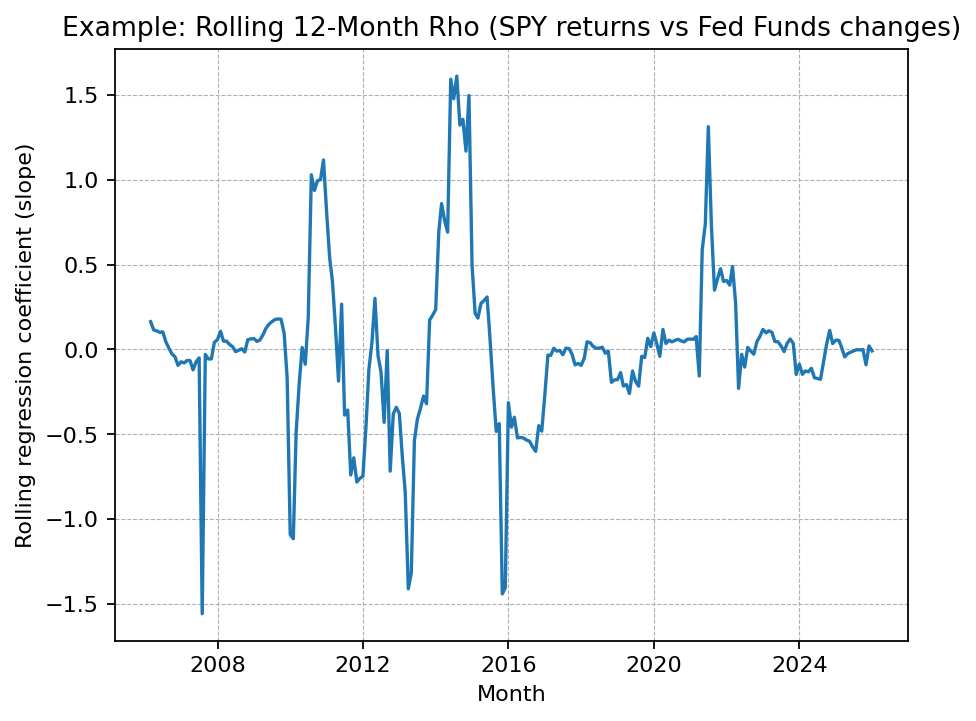
Chart updated daily using public data sources.
Methodology (summary): Monthly SPY returns (month-end close percent change) were regressed against
monthly changes in the Federal Funds Rate using a rolling 12-month window. The reported coefficient is the rolling
OLS slope for each window.
Scope & Terminology Note
“Rho” is used in multiple disciplines, including statistics and options pricing. This page refers specifically to a rate-sensitivity index concept, not any proprietary product, formula, or trading signal.